

You've got boxes on the floor, a few products that seem to disappear as soon as you list them, and a few that keep staring back at you every time you walk into your stock room. That's a normal stage for an independent brand. The hard part isn't only making something people want. It's figuring out which products move, where they move, and how fast they move without guessing.
That's where sell through rate earns its keep.
If you sell on your own site, through a marketplace, and maybe at a local pop-up or shop, one number can start to bring order to the mess. Not because it gives you a gold star or a failing grade. It helps you read demand with more honesty. A product can look weak in one place and strong in another. It can look slow when the underlying issue is stock depth. It can look healthy while obscuring missed reorder timing.
For makers in coffee, skincare, food, supplements, candles, and other everyday categories, this matters a lot. You usually don't have endless shelf space, endless cash, or endless patience for dead inventory. You need practical signals you can act on.
Table of Contents
- Sharpen pricing instead of panic discounting
- Trim your assortment with courage
- Fix the product page before you blame the product
- Match marketing to what you can actually fulfill
- Make nearby buying easier
From Piles of Products to Predictable Sales
One of the most common early-stage retail scenes looks like this. Your hero product is moving. Another product gets nice compliments but barely converts. A seasonal item did well at a market, then slowed down online. You know sales are happening, but you don't yet have a clean way to separate signal from noise.
That's when sell through rate stops being “retail jargon” and starts becoming useful.
At its best, it's a reality check. It tells you whether the stock you brought in is leaving your hands in a reasonable way. If you've been reading broader operations advice like this guide on managing inventory for Australian SMEs, you've already seen the same underlying challenge. Inventory decisions affect cash flow, storage space, and your ability to say yes when customers are ready to buy.
For independent makers, the benefit is confidence. You stop making every reorder decision from memory, vibes, or whichever product got the last nice Instagram comment. You start noticing patterns.
Practical rule: If you sell in more than one place, never treat all sales as one blended story.
A candle might move steadily on your own site because repeat buyers already know the scent. The same candle might move faster in a curated marketplace because discovery is stronger there. A food product might move best at a weekend market where sampling does the heavy lifting. If you lump all of that together, you miss the reason behind the result.
That's also why channel matters as much as product. If you're exploring selling directly through a marketplace built for independent brands, the useful question isn't only “did it sell?” It's “where did it sell cleanly, profitably, and predictably?”
Once you start reading sell through that way, inventory gets less emotional. You're no longer staring at piles of products and wondering what went wrong. You're building a repeatable way to decide what to make more of, what to reposition, and what to let go.
What Exactly Is Sell-Through Rate
The simple definition
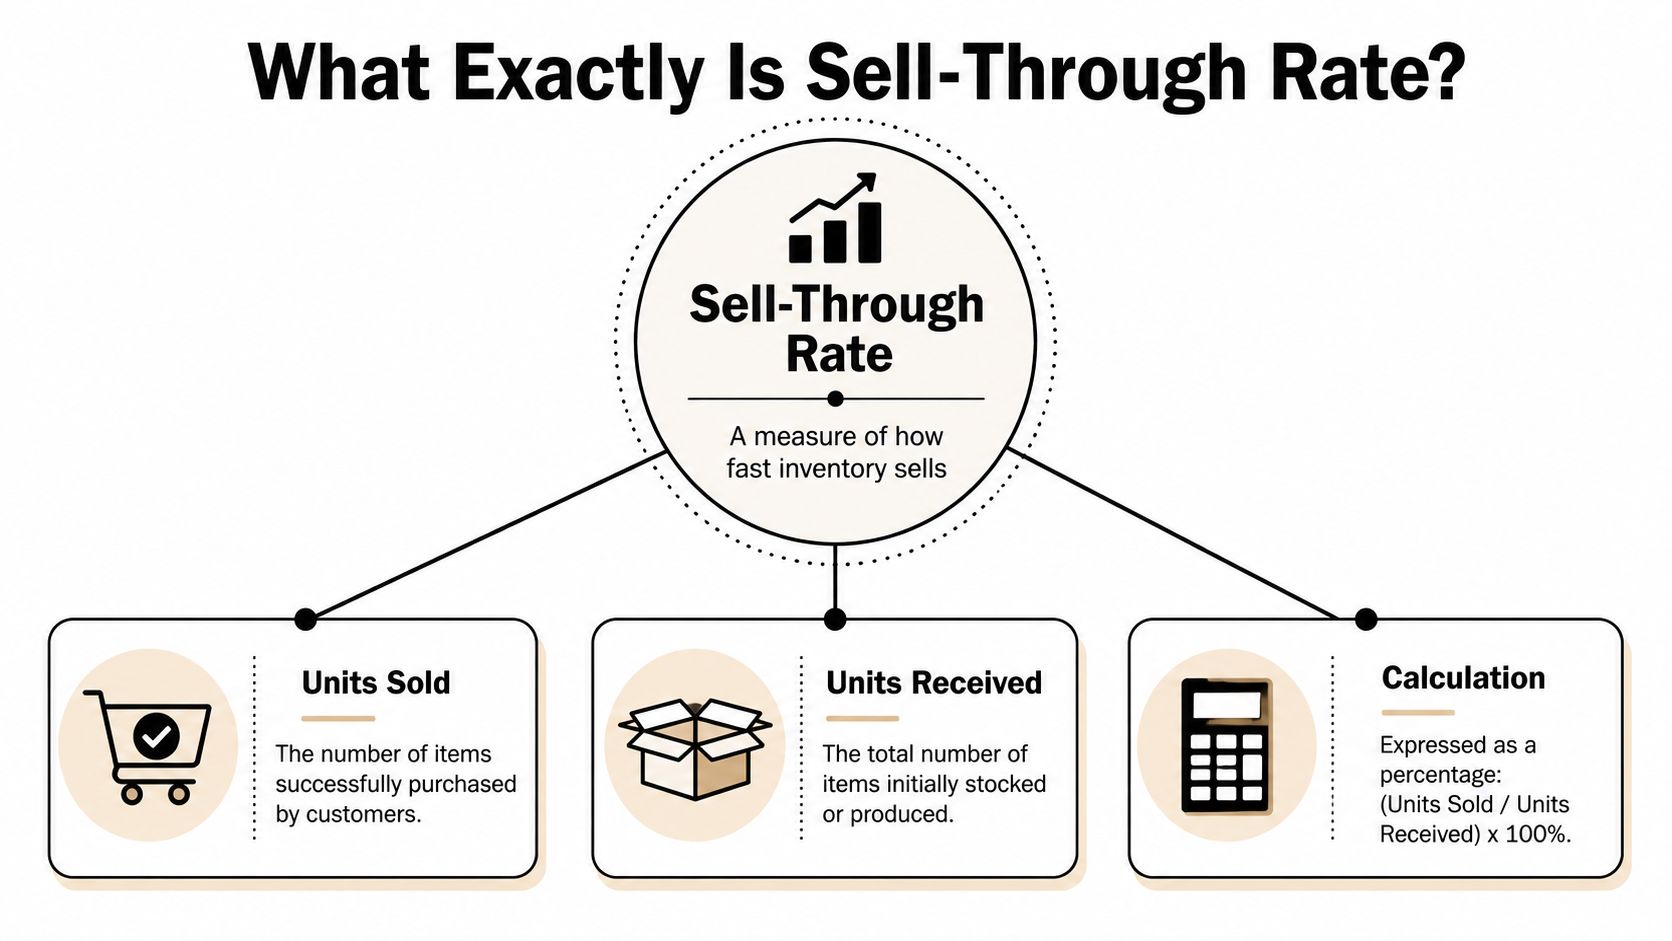
Sell through rate measures how much of the inventory you received has sold during a given period.
The plain formula is:
(Units sold / Units received) x 100
That's it. No finance degree required.
If you made a batch of jars of jam, candles, protein bites, or face oil, sell through rate tells you how much of that batch sold after it became available to customers. If you received stock from a manufacturer instead of making it yourself, same idea.
For a second explanation from a retail consulting perspective, this overview of what is sell through rate is a useful companion read.
A plain English example
Say you poured a run of candles and put them up for sale. You received or produced a set amount of inventory. Over the next week or month, some portion sold. Your sell through rate is the share of that stock that customers bought.
That makes it one of the cleanest ways to answer a basic retail question: is this inventory moving relative to what I brought in?
Here's why makers like this metric once they start using it:
- It's simple: You don't need advanced software to calculate it.
- It's actionable: If a product has weak sell through, you can inspect listing quality, channel fit, timing, and stock depth.
- It keeps inventory honest: Fast sellers and slow movers become easier to spot.
A product listing makes this easy to visualize. Take Scented Candle, Mango & Coconut Milk, Tropical Fruity, 9 oz Amber Jar, 40 Hour Burn, Cotton Wick | Genre Olfattivo by Loyaltie. It's described as bringing Miami sunshine home with a juicy mango-and-coconut-milk scent, hand-poured with a coconut-soy wax blend in an amber jar for a clean, warm glow. If you produced a batch of that candle and watched how many units sold over a chosen period, you'd have a direct read on that batch's sell through.
A good metric earns trust because you can explain it to yourself in one sentence.
That's what makes sell through rate useful. It's not trying to tell you everything. It tells you one clear thing, and it does it fast.
How to Calculate Your Sell-Through Rate
Start with units
The most practical way to calculate sell through rate is by units.
Use this formula:
Unit sell through rate = units sold / units received x 100
Keep it product-specific when you can. Don't start with “all candles” or “all skincare.” Start with one SKU, one scent, one size, one flavor, one bundle. That's where key decisions live.
A simple workflow looks like this:
- Pick a product
- Choose a time period
- Record how many units you received or made available
- Record how many units sold in that same period
- Run the formula
That period matters more than most founders realize. A launch week tells you one story. A full month tells you another. A holiday period tells you something else again.
Use revenue carefully
Some brands also calculate a revenue-based version. That can help when you want a broader view of how a collection is converting into cash, especially if products have different prices.
But use revenue carefully. Revenue can blur what units make obvious.
If one product has a higher price, it can make performance look stronger than it really is from an inventory standpoint. You may bring in a lot of units that move slowly, but the revenue still looks decent because a few higher-priced orders carried the result. That's why, for most independent makers, units first, revenue second is the safer habit.
A simple comparison helps:
| View | Best for | Watch out for |
|---|---|---|
| Unit sell through | Product-level inventory decisions | Doesn't show cash mix by itself |
| Revenue view | Cash flow and assortment value | Can hide slow-moving units |
Choose the right time window
The same product can look healthy or weak depending on the window you choose.
Use windows intentionally:
- First week after launch: Good for early traction and demand response
- Monthly view: Better for stable comparison across products
- Promotion period: Useful when you ran a bundle, discount, event, or email push
- Seasonal window: Helpful for products tied to weather, gifting, or local demand
Founders often trip themselves up. They compare a short launch burst with a quiet restock period and assume the product lost appeal. Sometimes it did. Sometimes the difference is just timing.
Quick check: Never compare a promotion week with a normal week unless you label them separately.
If you want this metric to stay useful, build one rule and stick to it. Track each product in the same type of time window each time you review it. That consistency matters more than complexity.
Is My Sell-Through Rate Good It's Complicated
Why the number alone doesn't help much
This is the question everybody asks first, and it's the wrong one to stay stuck on.
Industry guidance notes that healthy sell through ranges vary widely, and that the more useful practice is to track sell through weekly or monthly, by promotion period and by regional or channel cluster, because a product can show strong direct-to-consumer sell through and weak store sell through at the same time, as explained in Lightspeed's retail guidance on sell through rate.
That's the shift. Sell through rate is a diagnostic tool, not a universal pass-or-fail score.
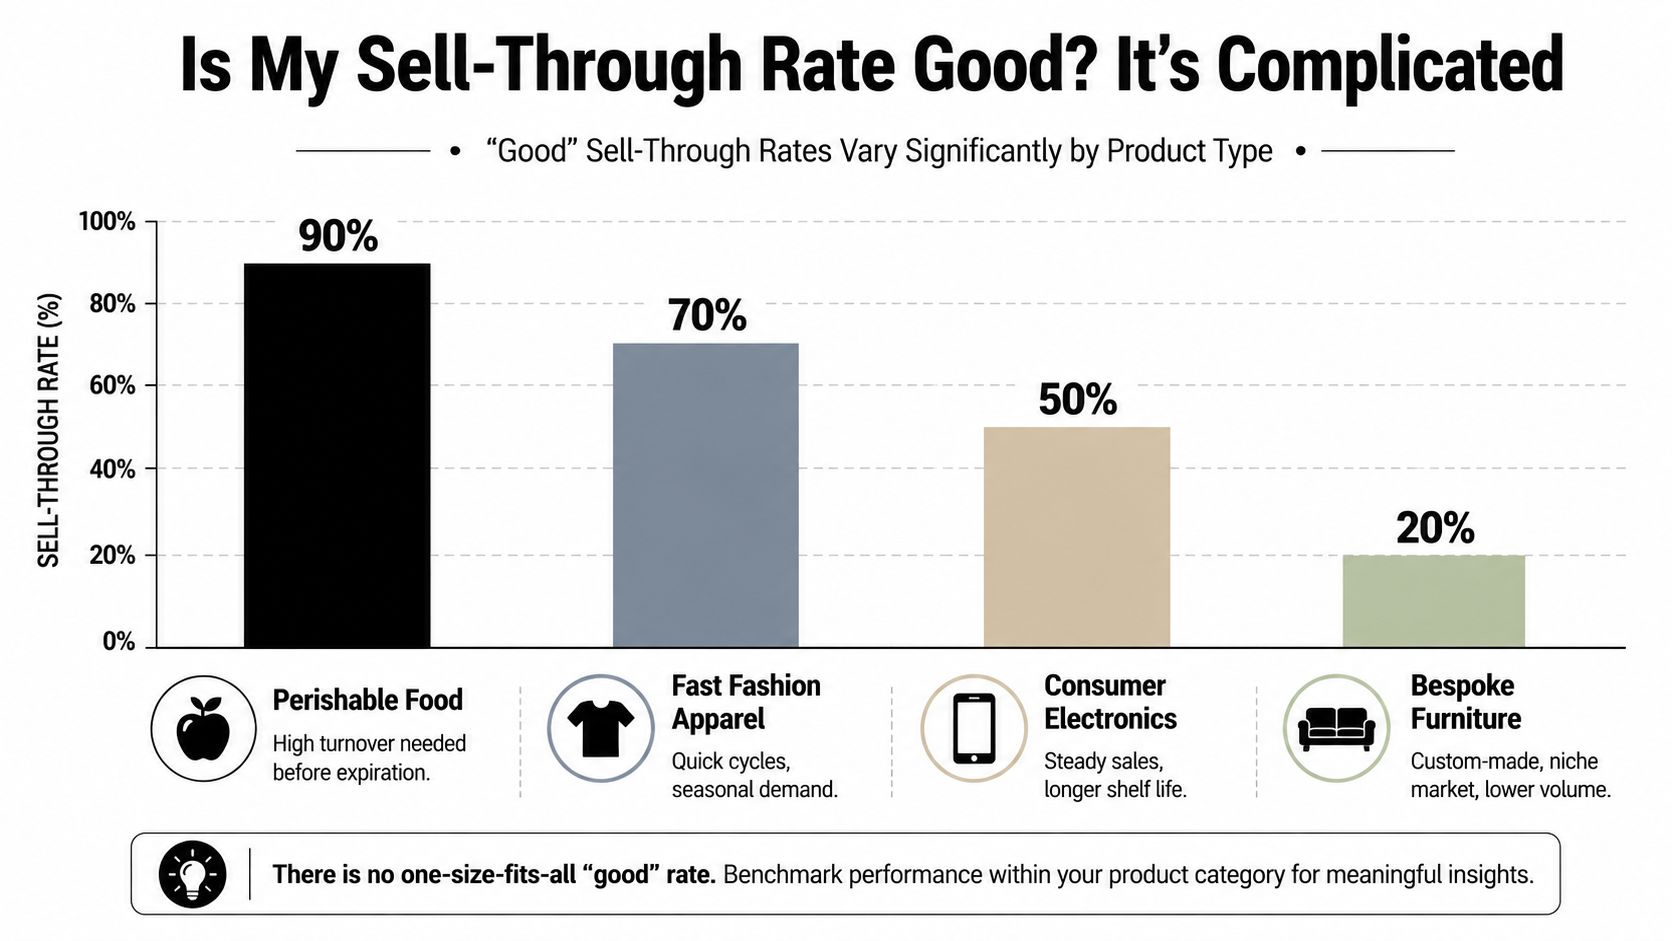
If you sell coffee, skincare, supplements, pantry goods, candles, or pet products, your baseline won't look the same as someone selling furniture or made-to-order decor. Even within one brand, products move differently because customers buy them for different reasons. Repeat-use goods have one rhythm. Gift items have another. Seasonal scents and flavors behave differently from all-year staples.
Read it by channel and timing
For independent makers, channel is where the insight usually shows up first.
A product can have:
- Strong sell through on your own site: repeat buyers, loyal customers, branded search
- Stronger sell through in a curated marketplace: better discovery, better fit with shoppers already browsing alternatives to mass-produced goods
- Uneven sell through at local events: strong sampling, impulse buying, weather or foot traffic effects
That's why the better question is, where is demand concentrated, and what should I do differently by channel? That interpretation follows the same industry guidance above, and it's much more useful than hunting for a magic benchmark.
Here's a practical way to read the number:
| If you see this | It may mean | What to test next |
|---|---|---|
| Strong on your site, weak in person | Your story or repeat demand is working better than in-person merchandising | Improve display, signage, sampling, or event fit |
| Weak on your site, strong in a marketplace | Discovery is the bottleneck, not the product | Improve search terms, photos, and traffic sources |
| Strong during one season, quiet in another | Timing matters more than you assumed | Adjust buying depth and launch calendar |
Don't ask whether the rate is “good” in the abstract. Ask what it says about place, timing, and product fit.
That mindset keeps you from overreacting. It turns a blunt KPI into a useful operating signal.
Five Ways to Improve Your Sell-Through Rate
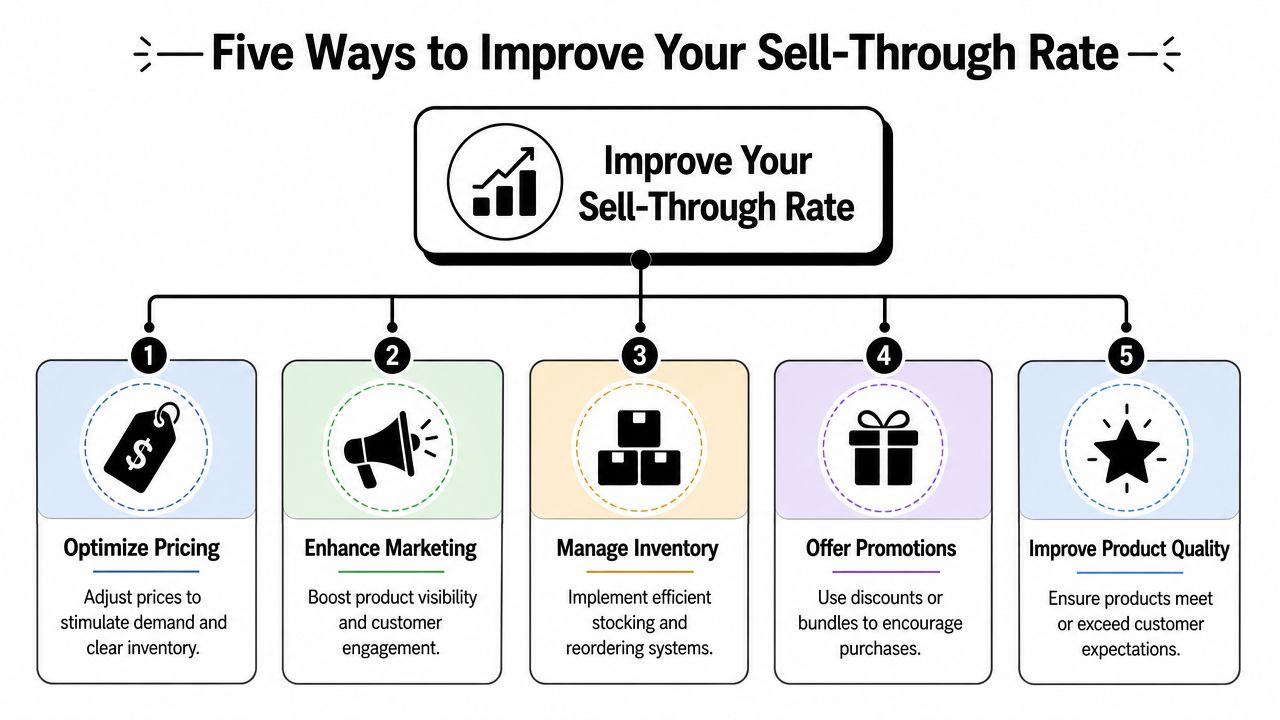
Improving sell through usually has less to do with one dramatic fix and more to do with a handful of cleaner decisions. This short walkthrough is worth watching before you start changing too much at once.
Sharpen pricing instead of panic discounting
Discounting is the move founders reach for first. It's also the one most likely to train customers to wait.
If a product is slow, ask better questions before you mark it down. Is the issue price, or is it weak positioning? Is the listing vague? Is the item sitting in the wrong channel? Did you bring in too much?
Use promotions with intent:
- Bundle complements: Pair a slower item with a reliable seller.
- Time-box offers: Make the reason for the offer clear and temporary.
- Protect your hero products: Don't discount the thing customers already buy happily.
A discount should solve a specific problem. It shouldn't be your default response to discomfort.
Trim your assortment with courage
A broad assortment can make a young brand look established. It can also make inventory messy fast.
Look for patterns in what consistently moves and what only sells when pushed. If three scents are steady and two always lag, you may not need five. If one lip balm size always wins, simplify. Depth on winners usually helps more than endless variation.
One useful habit is to split products into three working buckets:
- Keep building: clear traction, reorder confidence
- Fix and retest: decent interest, weak conversion, unclear positioning
- Retire gracefully: repeated drag with no convincing reason to keep forcing it
Fix the product page before you blame the product
A lot of “slow sellers” are really just badly presented sellers.
If your product page makes the buyer work too hard, sell through suffers. Strong pages do basic things well. Clear first image. Plain-language product name. Benefits up top. Ingredient or material details where relevant. Real use case. Clean shipping or pickup expectations.
This matters even more when people want an alternative to mass-produced goods but don't know your brand yet. They need enough clarity to trust what they're buying.
A weak listing can make a good product look forgettable.
Match marketing to what you can actually fulfill
Good marketing and bad inventory planning make an expensive pair.
Retail guidance on sell through warns that low sell through can reflect poor allocation, late replenishment, or overreliance on last year's buying patterns rather than true weakness. It also emphasizes using pre-season digital signals, test runs, and frequent reporting because sell through should be read alongside inventory received, on-hand stock, and demand signals so you don't under-order or over-discount products that are resonating, as outlined in Toolio's guidance on sell through and inventory context.
So before you run a push, line up the basics. Do you have enough stock to support attention? Do you know which products deserve traffic? Are you tracking what happens after the campaign starts?
If you're also cleaning up operations, this checklist on how to prevent stockouts and scale sales is useful because it keeps the focus on execution, not just promotion.
Make nearby buying easier
Many independent brands discover that local demand is stronger than expected once buying gets convenient.
That might mean clearer pickup options, faster local delivery, better event timing, or listing products where nearby customers already browse. A marketplace can help here if it reduces friction between discovery and purchase. For example, Loyaltie's seller information explains its role as a marketplace where people discover and buy directly from independent brands and makers in the US.
The win isn't “being everywhere.” It's making the right products easy to buy in the places where interest already exists.
Common Pitfalls That Can Mislead You
Low sell through doesn't always mean low demand
One of the easiest mistakes is reading low sell through as proof that customers didn't want the product.
That's not always what happened.
Retail guidance points out that low sell through can reflect poor allocation, late replenishment, or overreliance on last year's buying patterns rather than true product weakness, especially in health, food, and beauty categories where demand can spike. The same guidance says sell through should be read alongside inventory received and on-hand stock so founders don't over-discount or under-order products that are resonating, as noted earlier from Toolio.
Founders often misguide themselves into making the wrong move. They see a slow rate, assume weak demand, then cut price or stop ordering. Meanwhile, the underlying issue was thin inventory in the channel that mattered, poor timing, or inconsistent availability.
Stock problems can disguise themselves as demand problems.
Bad comparisons create bad decisions
The second trap is comparing unlike periods and unlike contexts.
A launch window is not the same as a normal replenishment cycle. A holiday market is not the same as a quiet midweek online period. A region with strong local demand is not the same as a region where your brand is still unknown.
Watch for these mistakes:
- Mixing channels together: your own site, wholesale, pop-ups, and marketplaces tell different stories
- Ignoring returns or cancellations: sales that reverse can distort your read
- Using inconsistent time windows: one week versus one month isn't an apples-to-apples comparison
- Forgetting stock depth: a fast early sellout can mean undersupply, not perfect planning
A misleading read usually leads to one of two bad outcomes. You discount something that needs better availability, or you reorder something that only had a brief spike in a special context. Neither helps.
How to Track and Report Your Sell-Through
A simple tracking habit that works
You don't need fancy reporting to start. A spreadsheet works.
Create one row per product per channel per time period. Then track a short set of fields: product name, channel, period, units received, units sold, on-hand stock, notes on promotion or seasonality, and your next action. That last column matters. A metric without a decision attached becomes busywork fast.
For a useful operating rhythm, review weekly for faster-moving products and monthly for steadier ones. That matches broader retail guidance that sell through is most helpful when monitored in recurring windows rather than checked randomly.
If you want a visual home base for maker-focused selling tools, resources, and platform support, seller resources for independent brands are a practical place to start.
The goal isn't to become obsessed with one metric. It's to get consistent enough that patterns stop hiding from you. Once that happens, reorders get cleaner, slow sellers become easier to fix or cut, and your brand starts feeling less reactive.
If you want a simpler way to discover and buy directly from independent brands across the US, explore Loyaltie, a marketplace where people find products from local makers without the usual middleman clutter.