
You've made the product, bought the ingredients, packed the first orders, and finally set a price that feels competitive. Then sales arrive, cash leaves your account, and you realize the money coming in isn't creating much room for the next batch. That's the uncomfortable moment when how to calculate product costs stops being a spreadsheet exercise and becomes a survival skill.
Independent brands and local makers win shoppers with better coffee, skincare, wellness goods, food, supplements, and pet products. But quality alone won't protect your business from rising ingredient prices, wasted materials, underpaid labor, or fees you forgot to include. You need a cost system built for messy small-batch production, not a factory fantasy.
Table of Contents
The Real Cost of Guessing Your Price
A candle maker I once advised priced a 6oz tin at $12 because it “felt competitive.” The product sold out over a weekend, then sold through two more restocks. On paper, that looked like a launch success. In the bank account, it looked like a leak.
Her real unit costs were $4.10 in materials, $2.85 in labor, $1.40 in packaging, and $0.90 in allocated overhead. She also subsidized $3.20 of shipping per order and paid a 15% platform fee. Once those costs were absorbed, each sale produced roughly a negative margin. The faster she sold, the faster she converted cash into inventory without building enough money to fund the next production run.
Practical rule: A sellout only proves that people wanted the product at that price. It doesn't prove the price was sustainable.
Guessing costs more than profit. It drains growth capital, makes restocking stressful, and forces you to choose between buying supplies and paying yourself. It can also hide which product is carrying the catalog and which one is subsidizing everyone else.
Start with five numbers
Build your product cost sheet around five parts:
- Direct costs, including ingredients, components, and inbound freight.
- Labor, valued at a rate you can live with, not an imaginary wage.
- Overhead, such as workspace, utilities, software, insurance, and equipment.
- Markup or margin, which turns cost into a selling price.
- Breakeven, the number of units you must sell before the shop covers its fixed costs.
The basic accounting foundation is straightforward: cost of goods sold equals opening inventory plus purchases minus closing inventory. That formula is included in the Canadian Industry Statistics glossary, and it matters because inventory valuation changes both reported product cost and profit.
For example, if a business starts with 10,000 in inventory, buys 40,000 more, and ends with 12,000, its cost of goods sold is 38,000. The same logic applies whether you sell soap from a home studio, coffee from a local roastery, or supplements through an online storefront.
Price is a decision you can change later. You can't make a weak cost foundation harmless by selling more. Get the underlying math right first, then use customer response to refine the shelf price.
Breaking Down Every Cost That Goes Into a Product
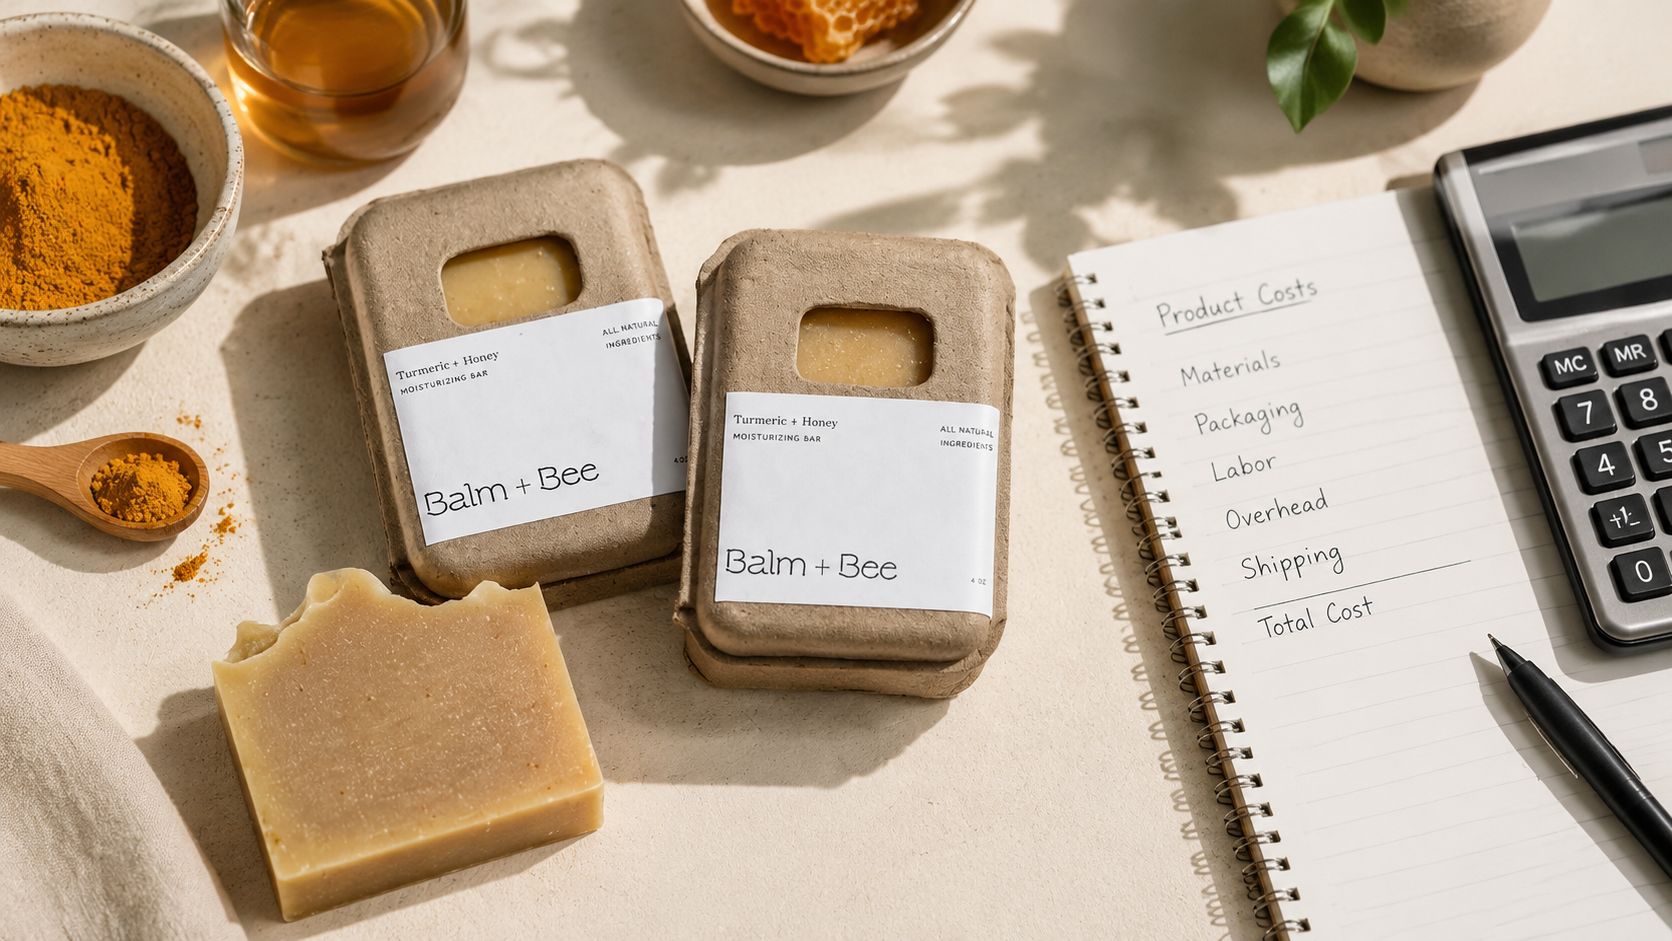
Take a four-bar cold-process soap batch. Your recipe might include olive oil, coconut oil, shea butter, lye, essential oils, colorant, and water. The ingredient invoice is only the beginning because the batch also consumes your time, packaging, and the cost of getting supplies to your workspace.
Count materials, time, and yield
Record the actual amount used, not the full purchase price of every container. If the recipe uses part of a bottle of essential oil, assign the batch the cost of that portion. Do the same for oils, butter, colorant, and lye.
Then calculate labor by task:
- Mixing: value the minutes spent weighing, preparing, and combining ingredients.
- Pouring: include mold preparation and cleanup.
- Cutting: count trimming and handling time.
- Curing: include the handling and storage work required during the cure period.
- Labeling: include labeling, wrapping, boxing, and order preparation.
Pay yourself an honest hourly rate. If the batch takes two hours of active work and your chosen rate is $25 per hour, labor is $50, not zero and not whatever remains after expenses.
Yield matters just as much. A recipe designed for four bars may produce less sellable inventory after cure loss, uneven cuts, trimming, or damaged pieces. Divide the batch total by sellable units, not the optimistic recipe yield. The farm production cost per unit guide is useful when you need a broader framework for allocating production expenses across finished units.
Add packaging and inbound freight
Packaging includes labels, shrink wrap, boxes, tissue, inserts, and any protective material used before the product reaches a customer. Add inbound shipping on your oils, lye, molds, and packaging supplies, then allocate that freight across the batch using a consistent method.
A practical landed-cost formula is:
(Materials + Labor + Packaging + Allocated Inbound Shipping) ÷ Sellable Units Produced = Per-unit landed cost
Here's a clean example using illustrative batch totals:
| Cost Component | Batch Total | Per Bar |
|---|---|---|
| Materials | $24.00 | $6.00 |
| Direct labor | $50.00 | $12.50 |
| Packaging | $8.00 | $2.00 |
| Allocated inbound shipping | $4.00 | $1.00 |
| Landed unit cost | $86.00 | $21.50 |
The figures above are a calculation example, not a universal soap cost. Your supplier quotes, recipe, yield, and labor rate determine your result. If a supplier raises the price of coconut oil halfway through the year, update the sheet immediately. A stale cost is worse than no cost because it gives you false confidence.
You can also compare how different independent makers present everyday goods, such as Tumeric + Honey Soap | Balm and Bee Apothecary by Loyaltie or handcrafted incense sticks from Rose of Eden Home and Scents. The products differ, but the costing discipline is the same: identify every input before deciding what the customer should pay.
Allocating Overhead Without Losing Your Mind
Overhead is the cost that doesn't fit neatly into one bar, tin, jar, or bag. Studio rent, electricity, software, insurance, equipment depreciation, and administrative time still support production, even when you can't point to one ingredient and say, “That belongs to this unit.”
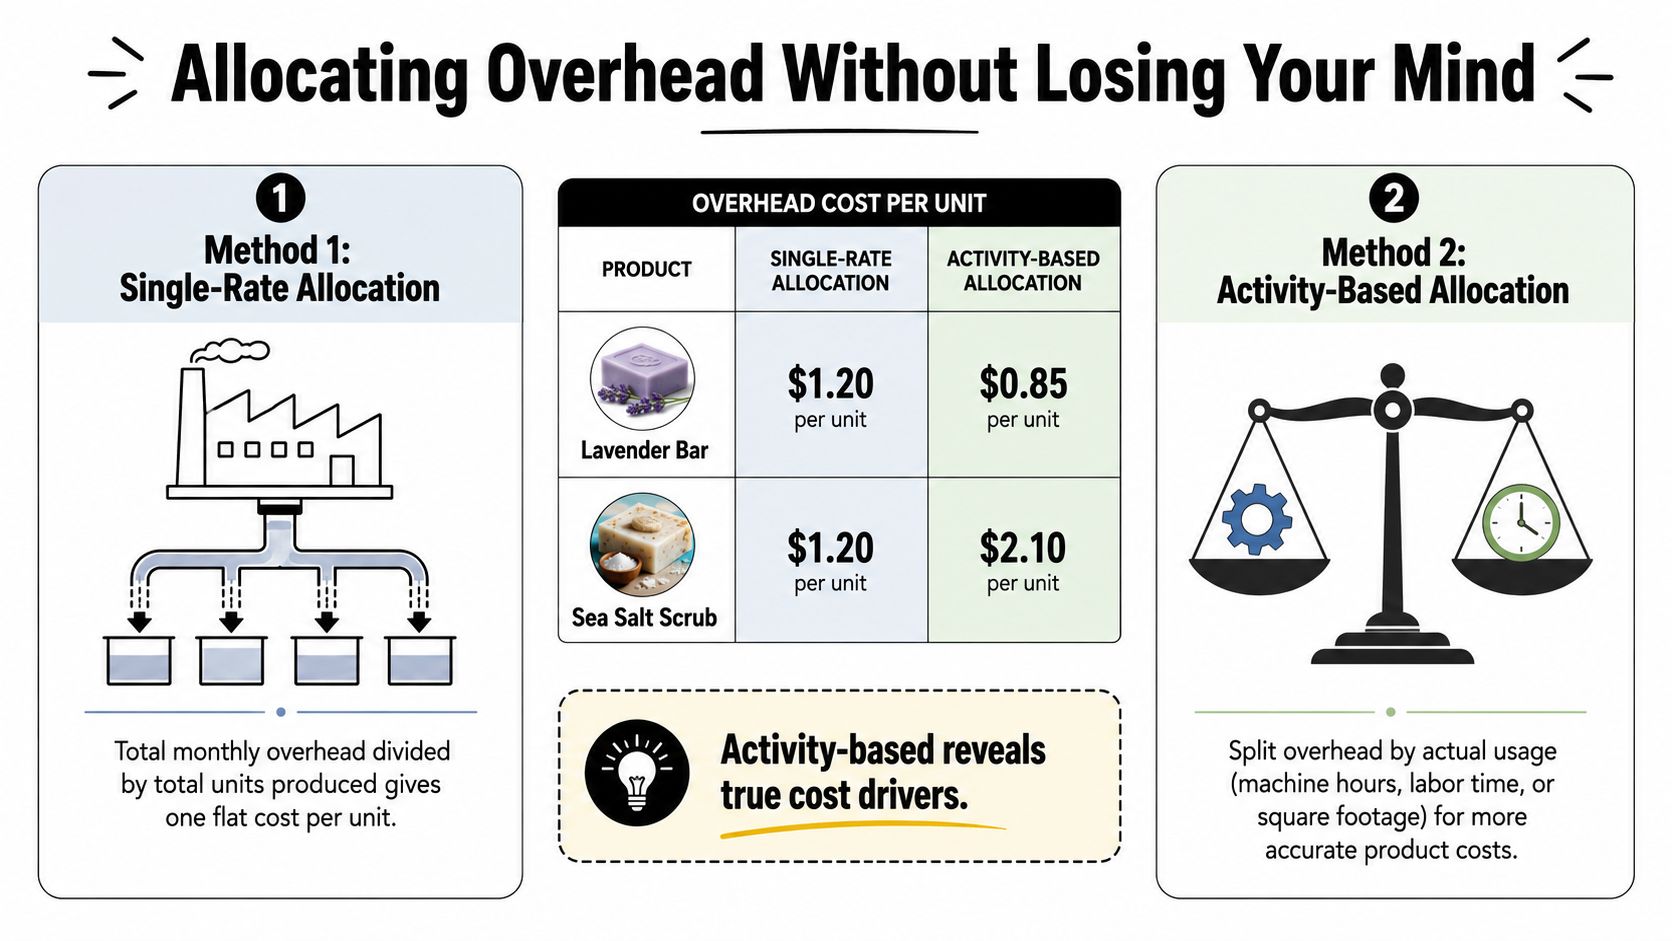
The simplest method is a single overhead rate:
Total monthly overhead ÷ Total units produced = Overhead per unit
A maker with $1,200 in monthly overhead who produces 1,000 units would assign $1.20 per unit. That approach is fast, easy to explain, and often perfectly reasonable when one product dominates sales and production uses resources in roughly the same way.
Choose the level of precision your catalog needs
A more refined approach uses activity-based costing, which assigns overhead through cost pools and drivers. The Penn State comparison of traditional and activity-based costing describes the core process: define direct materials, direct labor, and overhead, assign overhead pools to cost drivers, calculate a driver rate, and apply it according to actual usage.
For a handmade catalog, that might mean:
- Studio rent and utilities: allocate by square footage or production hours.
- Equipment depreciation: allocate by machine hours.
- Software and administration: allocate by sales volume or order activity.
Suppose your simple Lavender Bar takes little equipment time, while a Sea Salt Scrub requires more preparation, cleaning, and processing. A flat rate can make both products carry $1.20 of overhead, even though the scrub consumes more shared resources. Activity-based allocation could show $0.85 for the Lavender Bar and $2.10 for the Sea Salt Scrub. The point isn't mathematical decoration. It's finding the product that's subsidizing another.
Manufacturers have wrestled with this problem for decades. Plant-wide overhead rates driven by direct labor became common in the 1920s, while activity-based costing was formalized in the 1980s and reintroduced in 1987 by Robert Kaplan and Robin Cooper as a cause-and-effect approach. Those historical shifts are summarized in Traditional vs. ABC Costing.
Use the single-rate method for a one-product launch or a catalog with similar production demands. Switch to activity pools when you have three or more SKUs, multiple production days, or a loan application that requires more defensible numbers. Don't rebuild everything. Keep the existing spreadsheet, add columns for driver quantities, and refine only the products where the flat rate clearly distorts the cost.
Turning Unit Cost Into a Price That Actually Pays You
Once you know your landed unit cost, pricing becomes a choice instead of a guess. Assume the unit cost is $3.40. A markup formula multiplies that cost by a chosen factor:
Unit cost × markup multiplier = retail price
A 3x markup gives $10.20. That does not mean a 200% gross margin. It produces $6.80 of gross profit per unit and an actual gross margin of roughly 67%. Markup and margin describe different relationships, and confusing them is one of the fastest ways to underprice a product.
The margin formula works backward from the return you want:
Unit cost ÷ (1 − target margin) = retail price
At a true 65% gross margin, a $3.40 unit cost requires a price of about $9.71. The price is lower than the 3x markup example because the target margin is lower than the margin produced by that markup.
Compare the two methods before publishing
| Markup Multiplier | Retail Price | Gross Profit/Unit | Actual Margin % | Margin Target | Required Markup Multiplier |
|---|---|---|---|---|---|
| 2x | $6.80 | $3.40 | 50% | 50% | 2x |
| 2.5x | $8.50 | $5.10 | 60% | 60% | 2.5x |
| 3x | $10.20 | $6.80 | About 67% | 65% | About 2.86x |
| About 2.86x | About $9.71 | About $6.31 | 65% | 65% | About 2.86x |
The table excludes platform, payment, shipping, and promotional costs. Add those before you approve the final shelf price. A product can have a healthy gross margin and still leave little cash after selling expenses.
Margin check: Take your current price, subtract the unit cost, then divide the result by the current price. That backward calculation tells you what margin the shelf price actually produces.
Start with desired take-home pay, not with what competitors charge. Decide what each sale must contribute after product cost and selling fees, then back-calculate the price. If you're preparing specifications for larger production or vendor conversations, factory-ready specs pricing can help you think through how requirements affect cost before you commit to a quote. Makers refining their catalog can also review Loyaltie's seller resources while organizing pricing and product information.
Running the Numbers on Breakeven and Real Profit
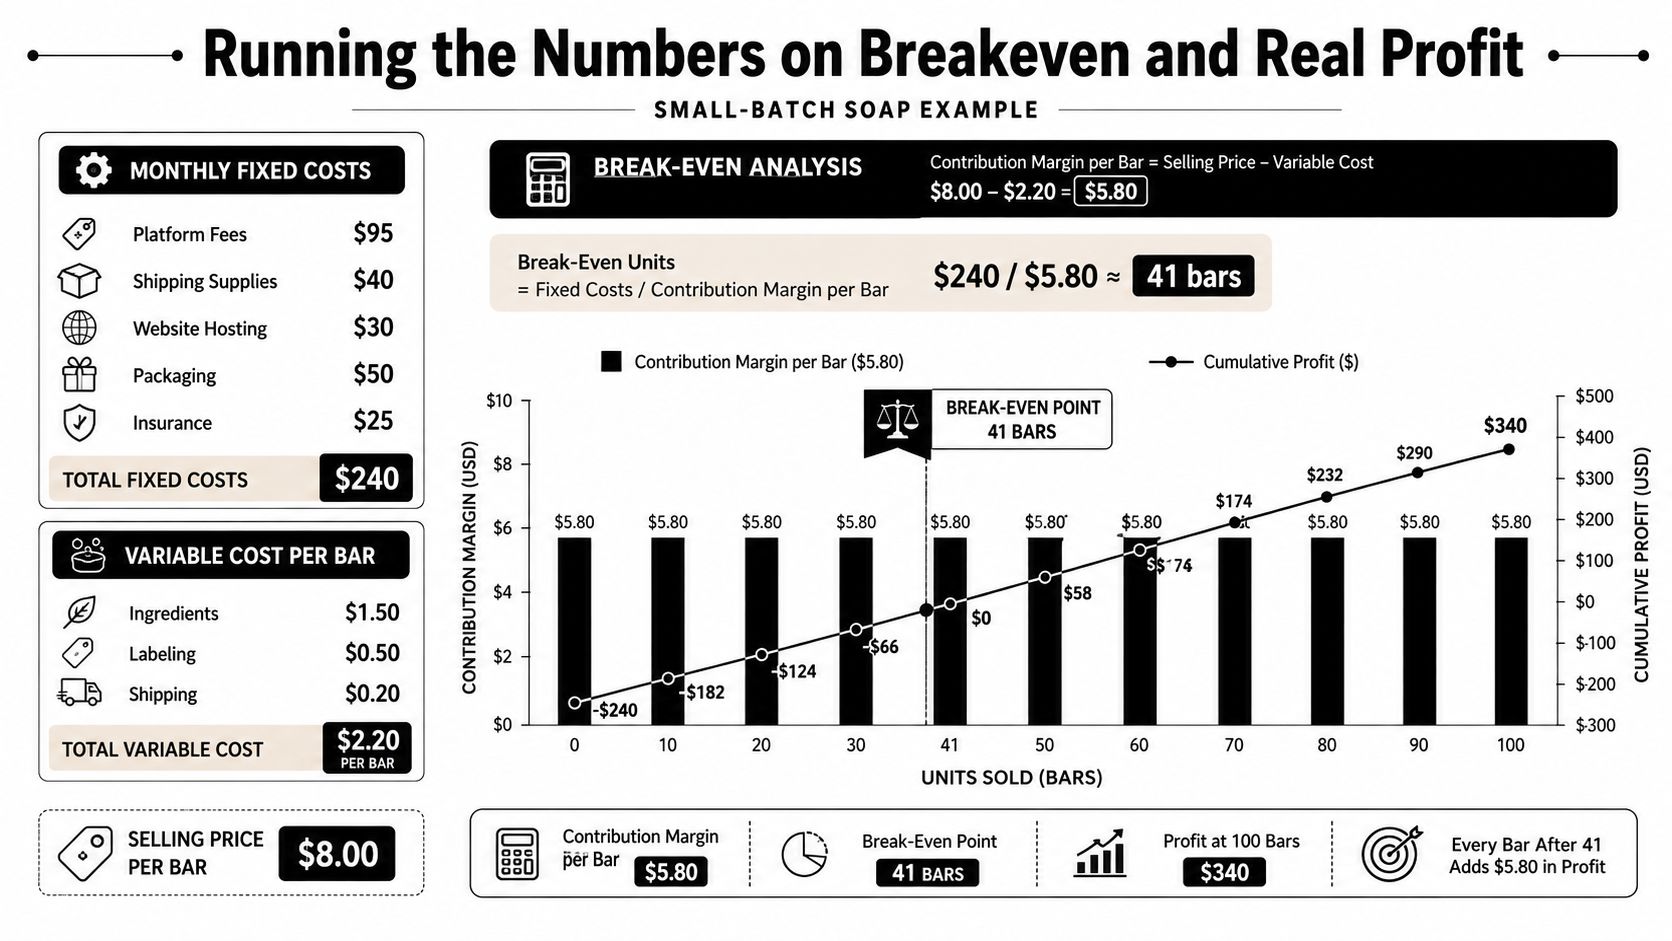
A small-batch soap maker can sell every unit above its product cost and still lose cash. Suppose monthly platform fees are $95, shipping supplies cost $40, and marketing costs $150. Add $300 for packaging design, amortized across the first production run. The working fixed-cost total is $585.
Use this formula:
Fixed monthly costs ÷ (Average price per unit − Variable cost per unit) = Breakeven units
At a price of $9.71 and a variable cost of $3.40, the contribution margin is $6.31 per unit. The maker needs roughly 93 units to cover $585 in fixed costs. A batch of 120 units leaves 27 units contributing profit after those fixed costs are covered, before taxes or owner draws.
See what a cheaper price changes
Cut the price to $7.99 to compete, and the contribution margin drops to $4.59. Breakeven rises to 128 units, more than this single batch can produce. The maker must run another batch, reduce fixed costs, or accept a later path to profitability.
“Make it up in volume” is a risky default. Volume helps only when every sale contributes enough to cover fixed costs and fund replenishment. A lower price may attract demand while leaving too little cash for volatile ingredients, packaging minimums, scrap, or the next production run.
Track three lines each month:
- Variable cost: ingredients, packaging consumed per order, and other unit-linked expenses.
- Fixed cost: recurring platform, shipping-supply, marketing, insurance, and workspace expenses.
- Owner return: what remains after the first two categories are covered.
Keep landed-cost adjustments and sellable yield current. If a batch produces less usable inventory than planned, unit cost rises, and your breakeven calculation must rise with it. The accounting relationship between inventory and cost of goods sold remains the foundation, as outlined in the Canadian Industry Statistics glossary. Your practical target is clear: know how many units must sell before the shop stops funding itself from your personal cash.
Pricing Smarter When You Sell on Loyaltie
Independent brands need a pricing system that can keep up with changing oils, coffee, botanicals, packaging, freight, and fulfillment costs. Loyaltie is a marketplace where people discover and buy directly from independent brands in the US, so your product editor and storefront should reflect the cost you carry, not the cost you remember from launch week.
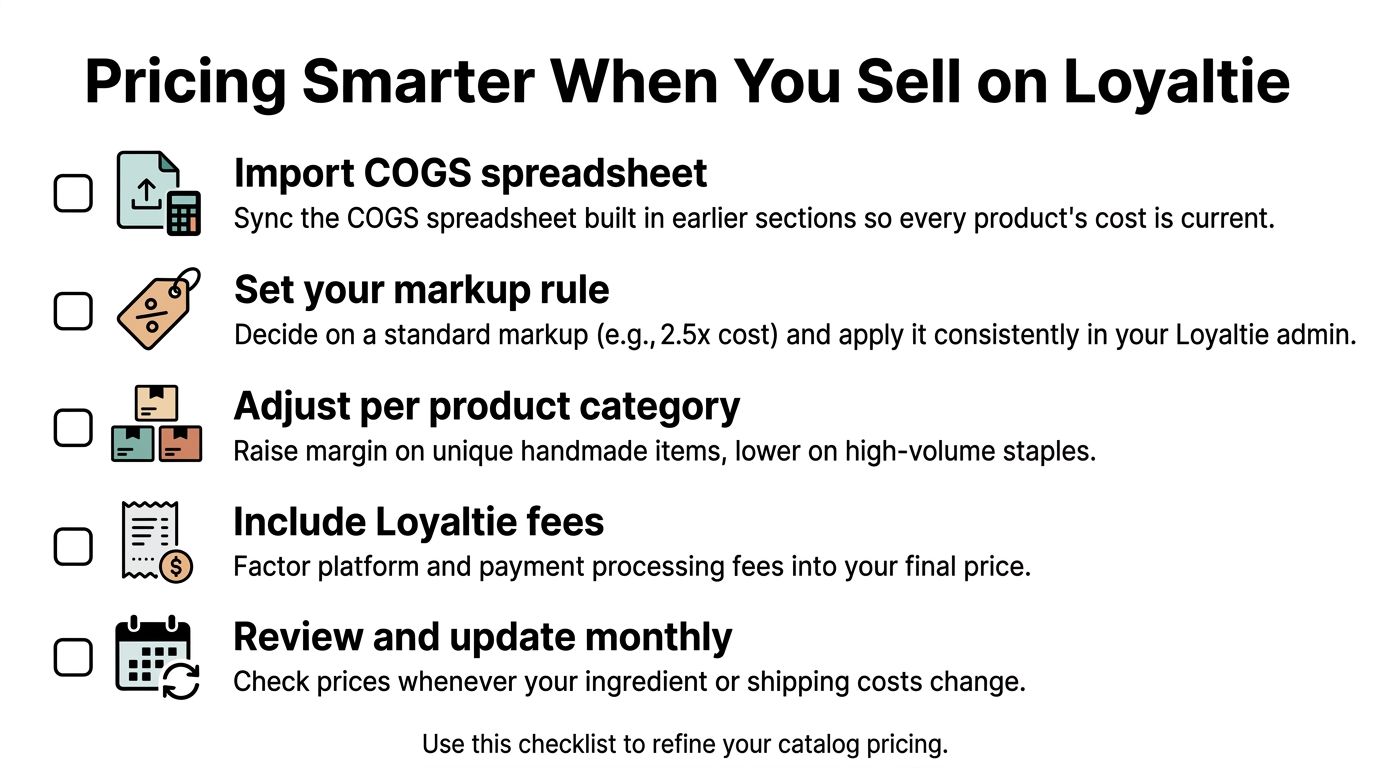
Start with a practical checklist:
- Import your COGS spreadsheet: Bring in the sheet containing materials, labor, packaging, inbound shipping, overhead, and sellable yield. Every SKU should carry a current unit cost.
- Set bundle pricing carefully: Bundles can increase the customer's total spend, but only when you calculate the combined unit cost first. A discount that looks attractive can erase the contribution margin.
- Use tax-inclusive display where required: If you sell in a region where the shelf price must include VAT, configure the displayed price accordingly rather than treating tax as an afterthought.
- Test targeted promotions: Use discounts and promotions on selected products or audiences. Blanket markdowns train customers to wait and reduce margin across the catalog.
- Review product performance monthly: Compare gross margin by product and flag any SKU where COGS exceeds 50% of selling price. That threshold is a management trigger, not a universal law.
- Re-cost quarterly: Ingredient, packaging, and shipping rates rarely stay flat. Compare supplier invoices against the spreadsheet and update the affected products.
If you're comparing software costs alongside product economics, review the loyalty platform pricing tiers as part of your broader tool budget. The right platform cost belongs in overhead, just like software, insurance, or workspace expenses.
You can use Loyaltie's seller marketplace to put these decisions into practice while keeping your direct-to-customer catalog organized. The storefront makes price testing inexpensive. The bigger risk is never repricing at all.
Independent brands already have a quality advantage with many shoppers. A survey reported in The Battle of the Brands found that 56% of respondents believed local brands offer higher quality, 50% preferred buying from local brands, and 44% believed local brands have lower quality. NielsenIQ also reported that buying local had the highest awareness among U.S. consumers in its study, at 46%, while a separate survey summary said 83% of Americans would choose a local product over a national brand when the options were similar, with 54% saying local products are higher quality, as reported in NielsenIQ's analysis of local shopping.
Use that quality advantage. Calculate the cost, price for the return you need, and make it easy for shoppers to discover what you've made.
Loyaltie gives independent brands a marketplace to showcase products and lets shoppers discover and buy directly from makers across the US. Build your COGS sheet, review your prices, and visit Loyaltie when you're ready to put better-costed products in front of local buyers.