
You know the feeling. Orders come in, your product gets kind messages, and it looks like things are working. Then a month later, repeat orders feel thinner than expected. A coffee brand notices first-time buyers aren't coming back for a reorder. A skincare maker sees strong launch-week sales, then silence. A pet product seller gets plenty of interest, but not enough second purchases.
That's where customer retention metrics become useful. They help you stop guessing why buyers fade out and start seeing what is happening. For independent brands selling everyday goods people can buy directly from the maker, retention isn't just about revenue. It's also about trust, habit, and whether your product earns a place in someone's routine.
If you're selling online or thinking about joining Sell on Loyaltie, these numbers can help you understand whether your buyers are sticking with you or drifting toward mass-produced alternatives.
Table of Contents
- Introduction to Customer Retention Metrics
- The core idea behind retention
- Why retention matters so much
Introduction to Customer Retention Metrics
A local wellness maker launches a new product line and gets a welcome rush of orders. Reviews are warm. Packaging photos show up on social media. Everything looks healthy from the outside. But a few months later, the founder notices something uncomfortable. New buyers keep arriving, yet the same names aren't showing up again.
That's the problem with relying on surface signals. A busy week can hide weak retention. A strong launch can mask churn. Customer retention metrics show whether people come back because the product fits their life, or whether they tried it once and moved on.
For independent brands, this matters more than it does for mass retail. When someone buys directly from the maker, they expect more than a transaction. They expect consistency, clear communication, and a reason to reorder without friction.
Practical rule: If repeat buying feels unpredictable, don't start by changing everything. Start by measuring what people do after the first order.
These metrics also help you protect the advantage independent brands already have. People across the US are actively looking for better alternatives to mass-produced coffee, wellness, skincare, food, supplements, and pet products. Retention tells you whether your brand is becoming one of those better alternatives in real life, not just in theory.
Understanding Customer Retention Concepts
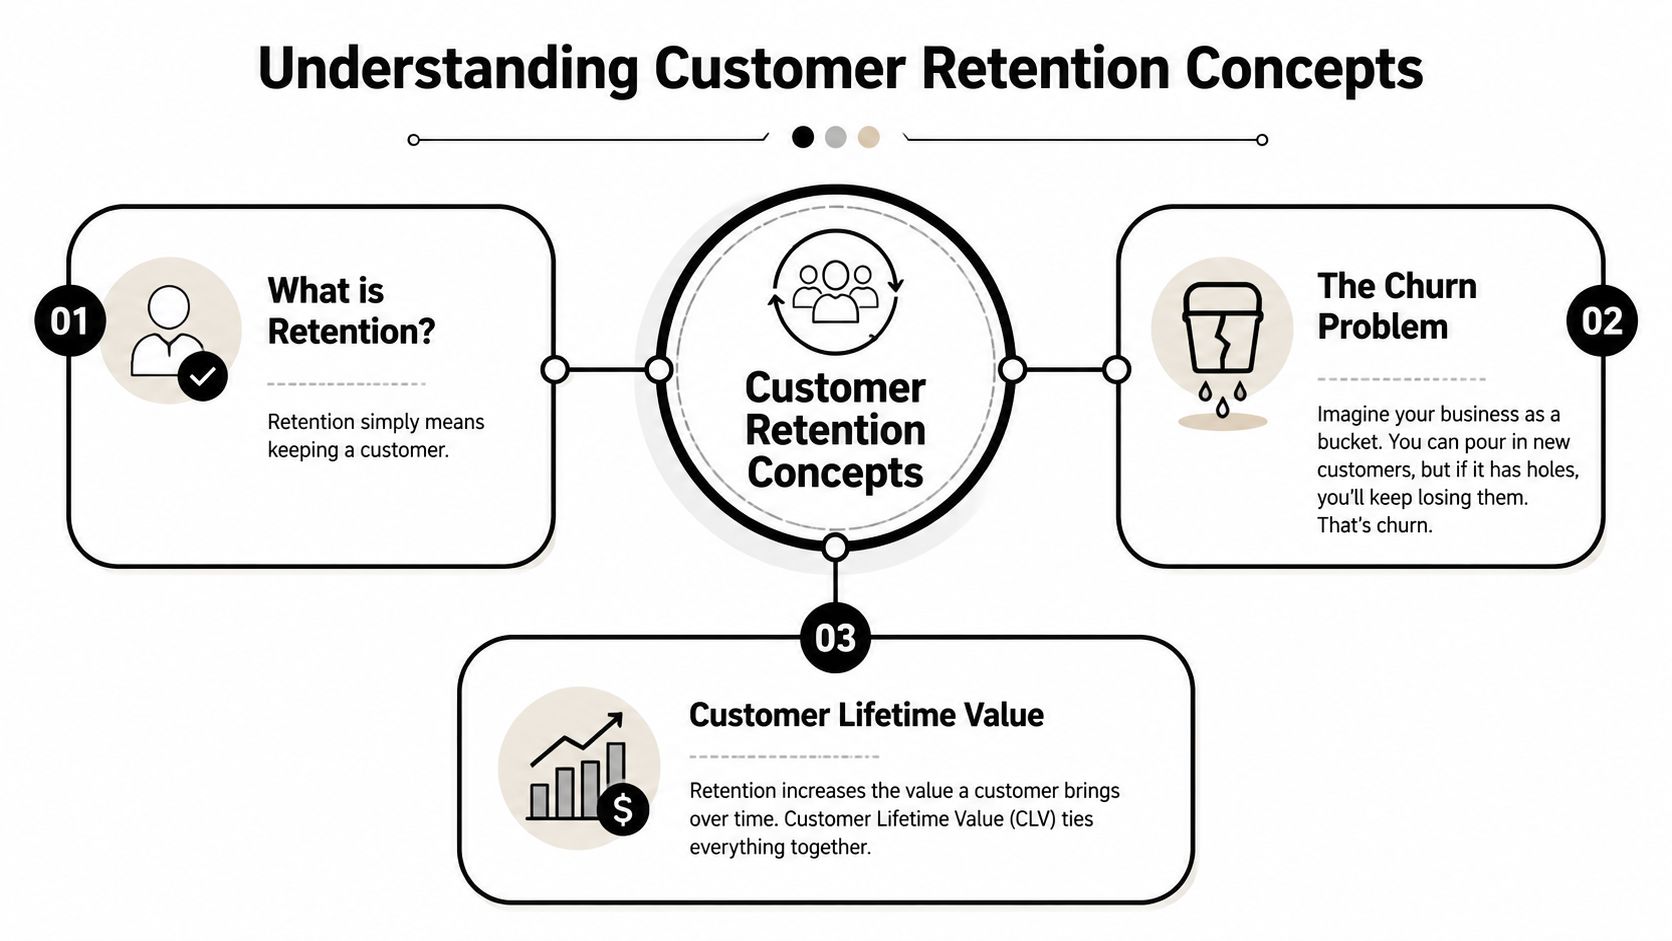
Retention sounds technical, but the idea is simple. A customer buys once. Then they buy again, or they don't. Customer retention metrics give that pattern a shape you can track.
The core idea behind retention
Think of your brand like a garden, not a billboard. New customers are new seeds. Retention is what happens after planting. Do people come back because the product worked for them? Did they remember you when they ran low? Did the experience feel easy enough to repeat?
Churn is the opposite. It's the leaky bucket problem. You keep pouring effort into bringing new buyers in, but some of them slip away before a second or third purchase.
Customer lifetime value ties the story together. It asks a bigger question: over time, how much value does one happy customer create through repeat orders?
Why retention matters so much
The global average customer retention rate across industries is approximately 66%, and improving that rate by just 5% can boost profits by 25% to 95%. That's one of the clearest reminders that keeping the right customers matters just as much as finding them.
Where readers often get confused is this: retention is not the same thing as growth. You can grow sales and still lose too many existing buyers. You can also have steady retention even when new customer acquisition slows down.
A few plain-language terms help:
- Repeat purchase means a customer ordered more than once.
- Cohort means a group of customers who started around the same time.
- NPS is a simple loyalty score based on whether buyers would recommend you.
- Time between purchases shows how long people wait before ordering again.
Retention is a relationship metric disguised as a math metric.
Key Customer Retention Metrics
Not every metric deserves equal attention. A coffee roaster with regular delivery habits should not read the same dashboard the same way as a maker selling occasional home goods. That's where a lot of generic advice falls apart.
The eight metrics worth watching
Here are the retention metrics that matter most for independent brands:
Customer retention rate
This is the percentage of customers you kept over a set period. If you want a plain-English refresher on customer retention rate, that guide is useful because it defines the metric without overcomplicating it.Customer churn rate
This tells you how many customers you lost. Globally, churn averages 34%, while high-engagement businesses with an NPS above 50 typically achieve retention rates over 75%.Repeat purchase rate
This shows how many customers placed a second order or more. For direct-to-consumer makers, this is often the fastest gut-check on whether the product really landed.Customer lifetime value
This connects retention to revenue. A buyer who reorders good coffee, pet food, or supplements over time is worth far more than a one-time buyer.Cohort analysis
This groups customers by when they first bought. It helps you spot whether a launch month, holiday period, or product line brought in people who remained customers.Net Promoter Score
NPS isn't a purchase metric. It's a loyalty signal. It tells you whether buyers are pleased enough to recommend you.Purchase frequency
This measures how often people buy. It matters most in categories with natural replenishment.Time between purchases
This tells you how long buyers wait before reordering. For wellness, food, coffee, and pet products, this is often an early warning sign.
Why frequency changes what matters
A handmade wall display and a bag of coffee don't behave the same way. Someone might love a home item and never need another soon. That doesn't automatically mean churn. But if a buyer who usually reorders pet treats disappears far past their normal cadence, that's a different signal.
The best metric is the one that fits the product's natural buying rhythm.
That's why independent brands need a more nuanced view than “retention good, churn bad.” High-frequency categories should pay closer attention to purchase frequency and time between purchases. Lower-frequency categories should focus more on repeat purchase windows, customer feedback, and cohort quality over longer stretches.
Calculating Metrics with Formulas
Math gets easier when you tie it to real buying behavior. You don't need advanced software to calculate the basics. A spreadsheet and clean order history can get you surprisingly far.
Start with the formulas that remove guesswork
The first formula to know is customer retention rate:
CRR = (End Customers - New Acquisitions) ÷ Start Customers × 100
That subtraction matters. Ignoring new acquisitions can overstate retention by 15–30% in volatile markets, according to Prospeo's client retention breakdown. If you brought in a burst of new buyers during a launch, your customer count may look steady even while older buyers disappeared.
Next is revenue churn rate:
Revenue Churn Rate = Lost MRR ÷ Starting MRR × 100
This matters if your brand has predictable reorder behavior or buyers on a plan. A stable customer count can still hide lost revenue if higher-value buyers stop coming back.
For brands trying to make smarter marketing decisions for D2C, these formulas are useful because they separate “we got attention” from “we kept customers.”
Sample Metric Calculations
| Metric | Formula | Example Calculation |
|---|---|---|
| Customer Retention Rate | (End Customers - New Acquisitions) ÷ Start Customers × 100 | A coffee brand starts with 100 customers, ends with 120, and acquired 30 new customers. CRR = (120 - 30) ÷ 100 × 100 = 90% |
| Customer Churn Rate | Lost Customers ÷ Start Customers × 100 | A skincare brand starts with 100 customers and loses 10. Churn = 10 ÷ 100 × 100 = 10% |
| Repeat Purchase Rate | Customers with more than one purchase ÷ Total customers × 100 | If 40 out of 100 buyers ordered again, repeat purchase rate = 40% |
| Purchase Frequency | Number of orders ÷ Number of unique customers | If a pet product brand had 150 orders from 100 customers, purchase frequency = 1.5 |
| Customer Lifetime Value | Average Order Value × Purchases per Year × Retention Rate | If average order value is $20, purchases per year are 4, and retention rate is 80%, CLTV = $64 |
A quick caution on that last row. The formula structure is useful, but the point isn't precision on day one. The point is consistency. If you calculate the same way every month, patterns become visible.
Benchmarks for Independent Brands
Benchmarks help you tell the difference between a normal dip and a real problem. Without them, every slow week feels alarming.
What strong looks like
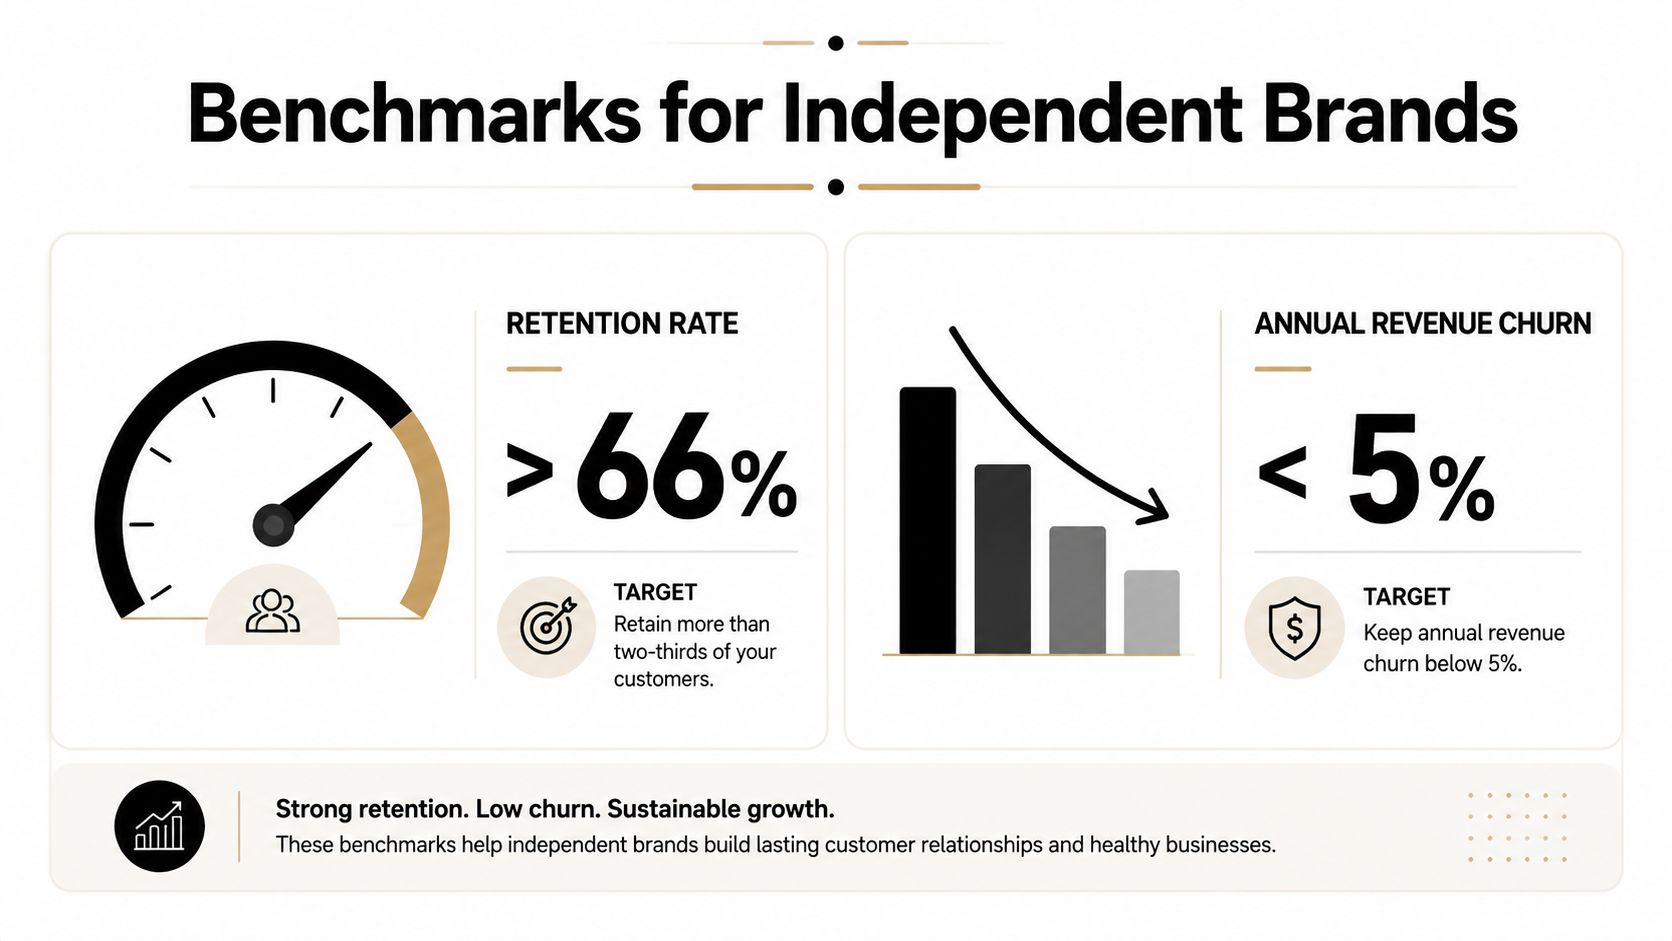
For a broad starting point, aim to stay above the global retention average of 66%. If you sell products people use repeatedly, falling under that line is worth investigating.
Revenue matters too. In recurring-purchase models, a 5% monthly revenue churn compoundly reduces annual revenue by 54%, and top performers reach 110–120% net revenue retention, based on WebEngage's retention metrics guide.
That's why many independent brands should watch revenue retention alongside customer counts. Losing a few occasional buyers is not the same as losing your most consistent reorder customers.
Benchmarks depend on what you sell
A useful way to think about benchmarks:
Coffee, supplements, pet products, pantry staples
Watch purchase frequency and time between purchases closely. These categories live on habit.Skincare and wellness products
Track reorder timing, but also pay attention to post-purchase feedback. People may take longer to evaluate results.Home and giftable goods
Lower purchase frequency doesn't always mean trouble. Cohort quality and referral behavior may say more than raw reorder speed.
Good benchmarks are category-aware. A slow reorder can be healthy in one product line and a warning sign in another.
Tracking Metrics with Simple Tools and Loyaltie
You don't need a huge analytics stack to track customer retention metrics well. Most independent brands can build a practical routine with a spreadsheet, order exports, and one clean review habit.
Start with the process first.
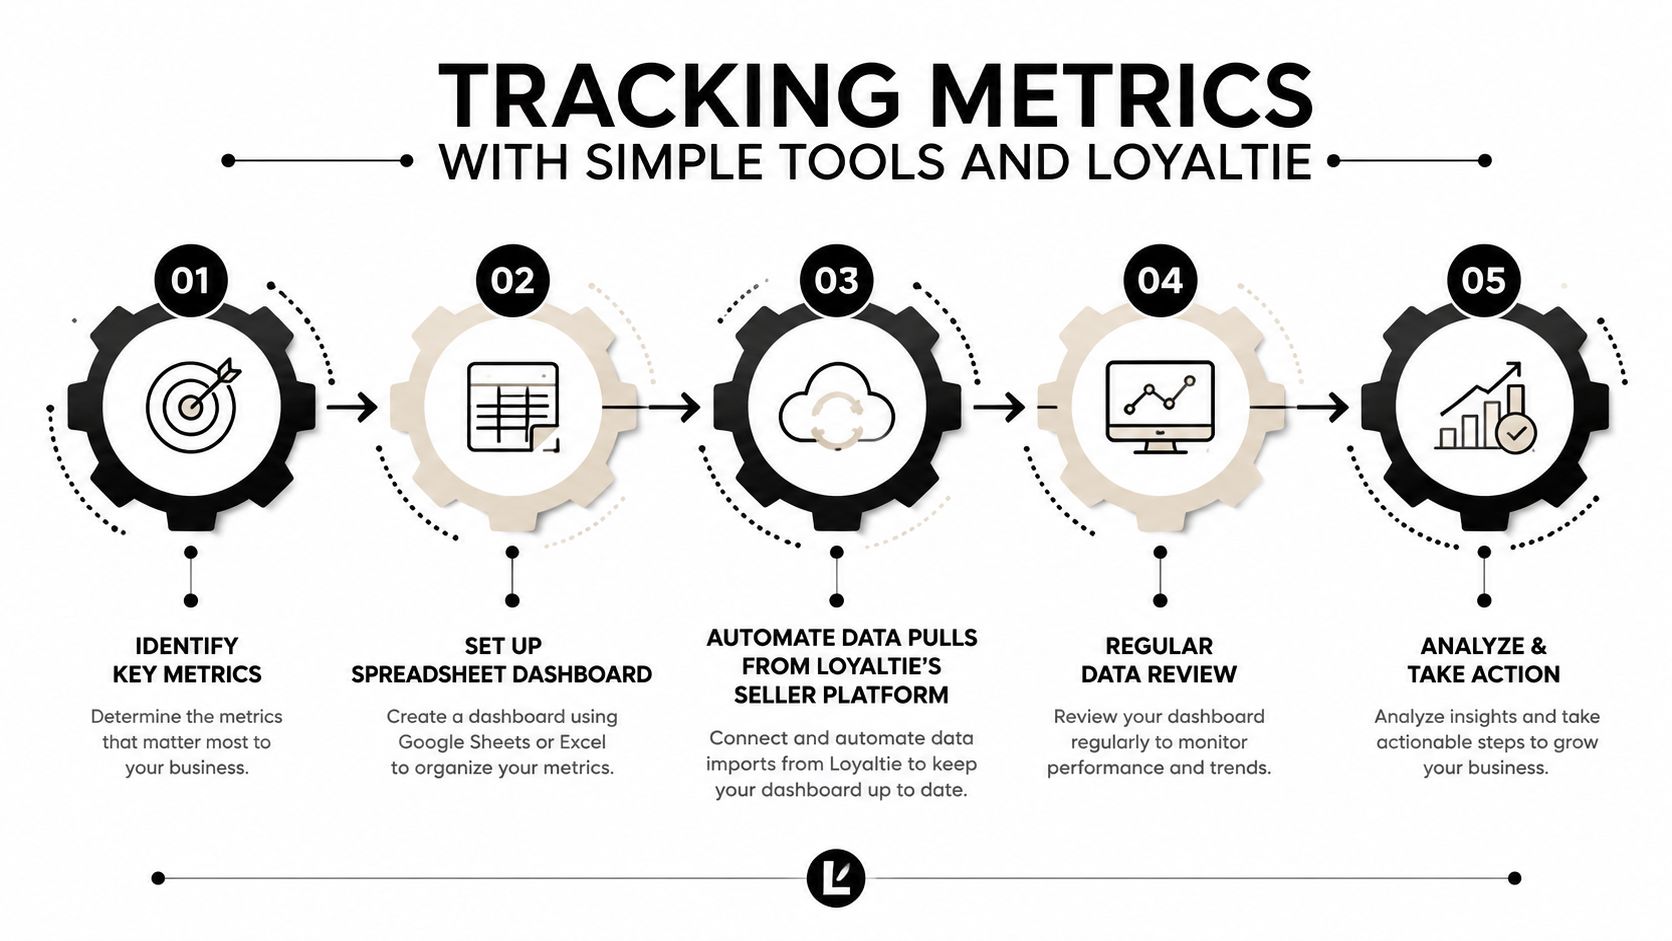
A simple tracking routine
Set up one sheet with these tabs:
- Orders tab with date, customer name or ID, product, and order value
- Customers tab with first purchase date and latest purchase date
- Monthly summary tab with retention, churn, repeat purchase rate, and time between purchases
- Notes tab for launches, packaging changes, sellouts, or shipping issues
If you want a model for how chat and behavior data can complement purchase data, this guide helps you understand FOMOchat engagement in a way that's easy to adapt.
For marketplace sellers, Loyaltie can also fit into this routine as one data source. It's a marketplace where people discover and buy directly from the best independent brands in the US, and seller-side order data can help you monitor repeat behavior over time.
A product catalog can even hint at tracking differences. For example, Triple Macrame Plant Hanger, Natural Cotton, Wall Mounted 3-Pot Display for Small Planters, 26x13 in | Evolve Botanica co by Loyaltie turns a blank wall into a mini plant gallery. This triple macramé hanger is handwoven from natural cotton and designed to hold three small planters in one compact display, perfect for apartments and tig. A product like that likely needs a different retention window than coffee or supplements because buyers may not reorder quickly.
Later in your review process, video walk-throughs can help you standardize how you check reports:
What to review each week and month
Keep the routine light enough that you'll do it:
- Weekly check for unusual drop-offs in repeat orders
- Monthly check for retention, churn, and average time between purchases
- Quarterly review for cohort patterns by product type
Three questions make the dashboard useful:
- Are buyers coming back at the pace you'd expect for this category?
- Did newer cohorts behave better or worse than older ones?
- Are your best customers staying, or are you replacing them with one-time buyers?
Actionable Strategies to Improve Retention
Numbers only help if they change how you serve buyers. The good news is that independent brands already have one major advantage. Independent retailers report that 96% of consumers cite their superior personalized service as a key edge over chains, according to the Institute for Local Self-Reliance survey findings. That no-middleman connection is not a side benefit. It's a retention tool.
Fix the moments that cause drop-off
Start with the places where repeat buying usually breaks:
After the first order
Send a clear follow-up with care instructions, usage ideas, or reorder guidance. A skincare buyer may need help using the product consistently before they decide it belongs in their routine.Right before a likely reorder window
If you sell coffee, supplements, pantry goods, or pet products, remind buyers when they may be running low. Don't make the message generic. Reference the product they bought and the benefit they came for.After feedback signals hesitation
If a buyer sounds unsure, reply like a real person. Independent brands win here because they can answer directly, without a middle layer.
A buyer who feels known is easier to keep than a buyer who feels processed.
Match the tactic to the product type
Many brands miss the mark when considering retention. The right retention strategy depends on purchase frequency and product type.
For high-frequency goods, focus on convenience:
- Offer a buy-on-a-plan option for products people use regularly.
- Make reordering easy from email or SMS reminders.
- Track time between purchases and act when it starts stretching.
For results-based products like wellness or skincare, focus on reassurance:
- Check in after the product has had time to be used.
- Ask a simple NPS-style question.
- Use replies to improve instructions, packaging inserts, or product education.
For lower-frequency goods, focus on staying memorable:
- Share care tips, styling ideas, or complementary product suggestions.
- Invite previous buyers into early access for new drops.
- Keep the relationship warm even if the next order takes longer.
A simple operating rhythm helps. Pick one metric that needs work. Pair it with one action. Then review after a full buying cycle, not after a few days.
If you want practical seller guidance, the Loyaltie seller resources page is a straightforward place to explore marketplace and retention-related education without overbuilding your process.
Conclusion and Next Steps
Customer retention metrics help you uncover the story behind your orders. They show whether buyers are returning, how quickly they reorder, where churn starts, and which product categories need a different approach. For independent brands, that nuance matters because coffee, skincare, supplements, pet products, and home goods all create different buying patterns.
Your next move is simple. Track a small set of metrics, review them on a steady schedule, and adjust one part of the customer experience based on what the numbers show. That's how retention becomes something you can improve, not just worry about.
If you want a simple place to discover and buy directly from independent brands across the US, browse Loyaltie. It brings together local makers, no-middleman shopping, and everyday products that offer a better alternative to mass-produced options.